|
||
|
|
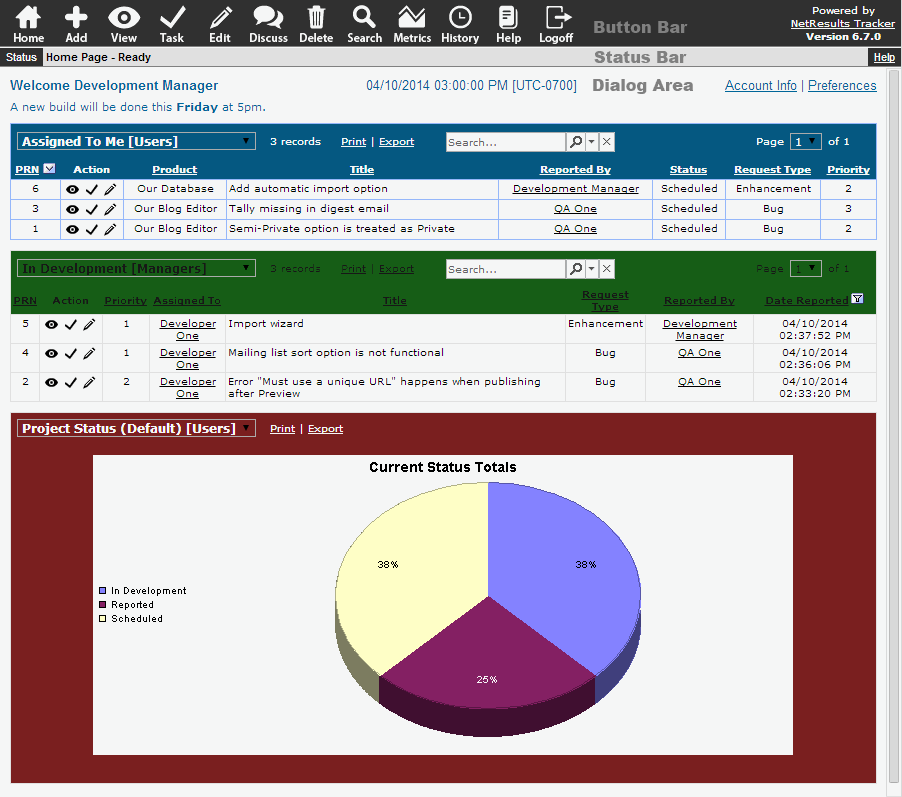
After logging in, each user is presented with their home page. By default, this page displays a report displaying the records assigned to the user and the records reported by the user.

Home Page Reports
The Tracker Home Page displays reports generated by saved queries or charts. Any saved query or saved chart can be displayed on the Home Page. The saved queries and charts that can be displayed for each particular user depend on the user type (non-Restricted or Restricted) and on the user's group membership.
Up to three reports can be displayed on the Home Page. The results of each report are generated by the saved query or saved chart selected. The format of each report (e.g. column headings, sort order, chart properties) is determined by the saved report layout or saved chart layout associated with the saved query or chart selected.
By default in most Tracker templates, the following saved group queries are displayed on the Home Page:
For non-Restricted users
For Restricted users
The First Home Page Report is called "Added By Me [RestrictedUsers]".
The saved report layout associated
with this saved query is "Added By Me [RestrictedUsers]".
Customizing the Home Page
The following elements of the Home Page reports can be customized. Click on one of the items listed below to see details:
Selecting a Saved Query or Chart for one of the Home Page Reports
To temporarily select a different saved query or chart to be displayed for any of the
Home Page reports while you are logged in, you can click on the pulldown menu
displayed at the top of
one of the Home Page reports. All personal and group saved queries and / or
saved charts to which you have
access will be displayed in the pulldown.
To select a different saved query or chart to be displayed for any of the Home Page reports by default when you log in, you can select the reports by clicking on the Personal Preferences link in the upper right corner of the Home Page. In the Personal Preferences page, scroll down to the Report Settings section. Select one of the saved queries or saved charts listed in the pulldown menu for either the First , Second, or Third Home Page Report fields. Click OK to save your selection. You also have the option to select "<No Report>" for the Second and Third Home Page Report fields.
To set the Home Page reports to be displayed by default when any new user accounts are added to the workgroup, set the First, Second, and Third Home Page Report fields in the User Preferences section.
You also have the option of creating your own saved query or saved chart to be used as one of the Home Page reports. Instructions for creating a new saved query can be found in the Using Saved Queries & Reports Help section. Steps for creating a new saved chart can be found in the Metrics Help section.
Changing the criteria used to generate a Saved Query or Saved Chart displayed
as one of the Home Page Reports
To modify the criteria in a Saved Query, review the
information in the section Edit a Saved
Query. To modify the criteria in a Saved Chart, review the information in the
section Edit a Saved Chart section.
When a Saved Query is selected as one of the Home Page Report, the way this report is displayed (columns, field order, sort order) on the Home Page is based on the settings of the saved report layout associated with the Saved Query selected. You can either choose a different report layout to be associated with a Saved Query or you can edit the report layout already associated with a Saved Query. For information on either of these options, please review the Saved Reports section.
Similarly for the Saved Charts, each Saved Chart has a Chart Layout associated. You can choose a different chart layout or edit an existing chart layout to change the chart's formats (e.g. whether it is a bar chart or pie chart, whether it has a legend, etc.). Information on Chart Layouts can be found in the Metrics section.
NetResults Tracker © 1997-2014 NetResults Corporation. All rights reserved.